by Josef Weiss

When minimizing risk, analysts and administrators will often need to focus on the most prevalent threats to their environment first. The greatest threat can differ though based on volume, exposure, and exploitability. This dashboard provides analysts with information needed to determine where the greatest risk may exist.
Risk is often determined by the highest rated vulnerabilities, and the volume of their presence on the network. That approach, while valuable, can miss other ways in which risk is present in an environment. Internet facing subnets with a small number of exploitable vulnerabilities is a greater business risk than a large number of intranet only vulnerabilities.
This dashboard allows analysts to break down the different categories of risk assessment into various groups. Breaking down the data in such a way allows better focus when assessing risk as that risk relates to an organization. Analyzing risk this way helps administrators focus and plan remediation efforts with greater efficiency.
Tenable.sc Continuous View (CV) provides security analysts the most comprehensive and integrated view into risk analysis available to organizations. With native ability to detect more vulnerabilities, Tenable.sc CV has the ability to analyze risk across many systems such as operating systems, network devices, virtual machines, databases, tablets, phones, web servers, and critical infrastructure.
The dashboard and components are available in the Tenable.sc Feed, a comprehensive collection of dashboards, reports, assurance report cards and assets. The dashboard can be easily located in the Tenable.sc Feed under the category Threat Detection & Vulnerability Assessments.
The dashboard requirements are:
- Tenable.sc 5.6.1
- Nessus 5.9.0
Tenable's Tenable.sc Continuous View® (Tenable.sc CV™) provides continuous network monitoring, vulnerability identification and security monitoring. Tenable.sc CV™ is continuously updated with information about advanced threats, zero-day vulnerabilities, and published exploits to ensure up to date assessment of risk. Active scanning periodically examines the applications on the systems, the running processes and services, web applications and configuration settings. Passive listening provides real-time discovery of vulnerabilities on operating systems, protocols, network services, wireless devices, web applications, and critical infrastructure. Tenable.sc CV™ provides an organization with the most comprehensive view of the network and actionable information to support mitigation efforts and reduce cyber risk. Teams can better monitor and assess vulnerabilities appearing across the network with Tenable.sc CV™. Tenable enables powerful, yet non-disruptive, continuous monitoring that will provide organizations with the information needed to reduce risk within the enterprise.
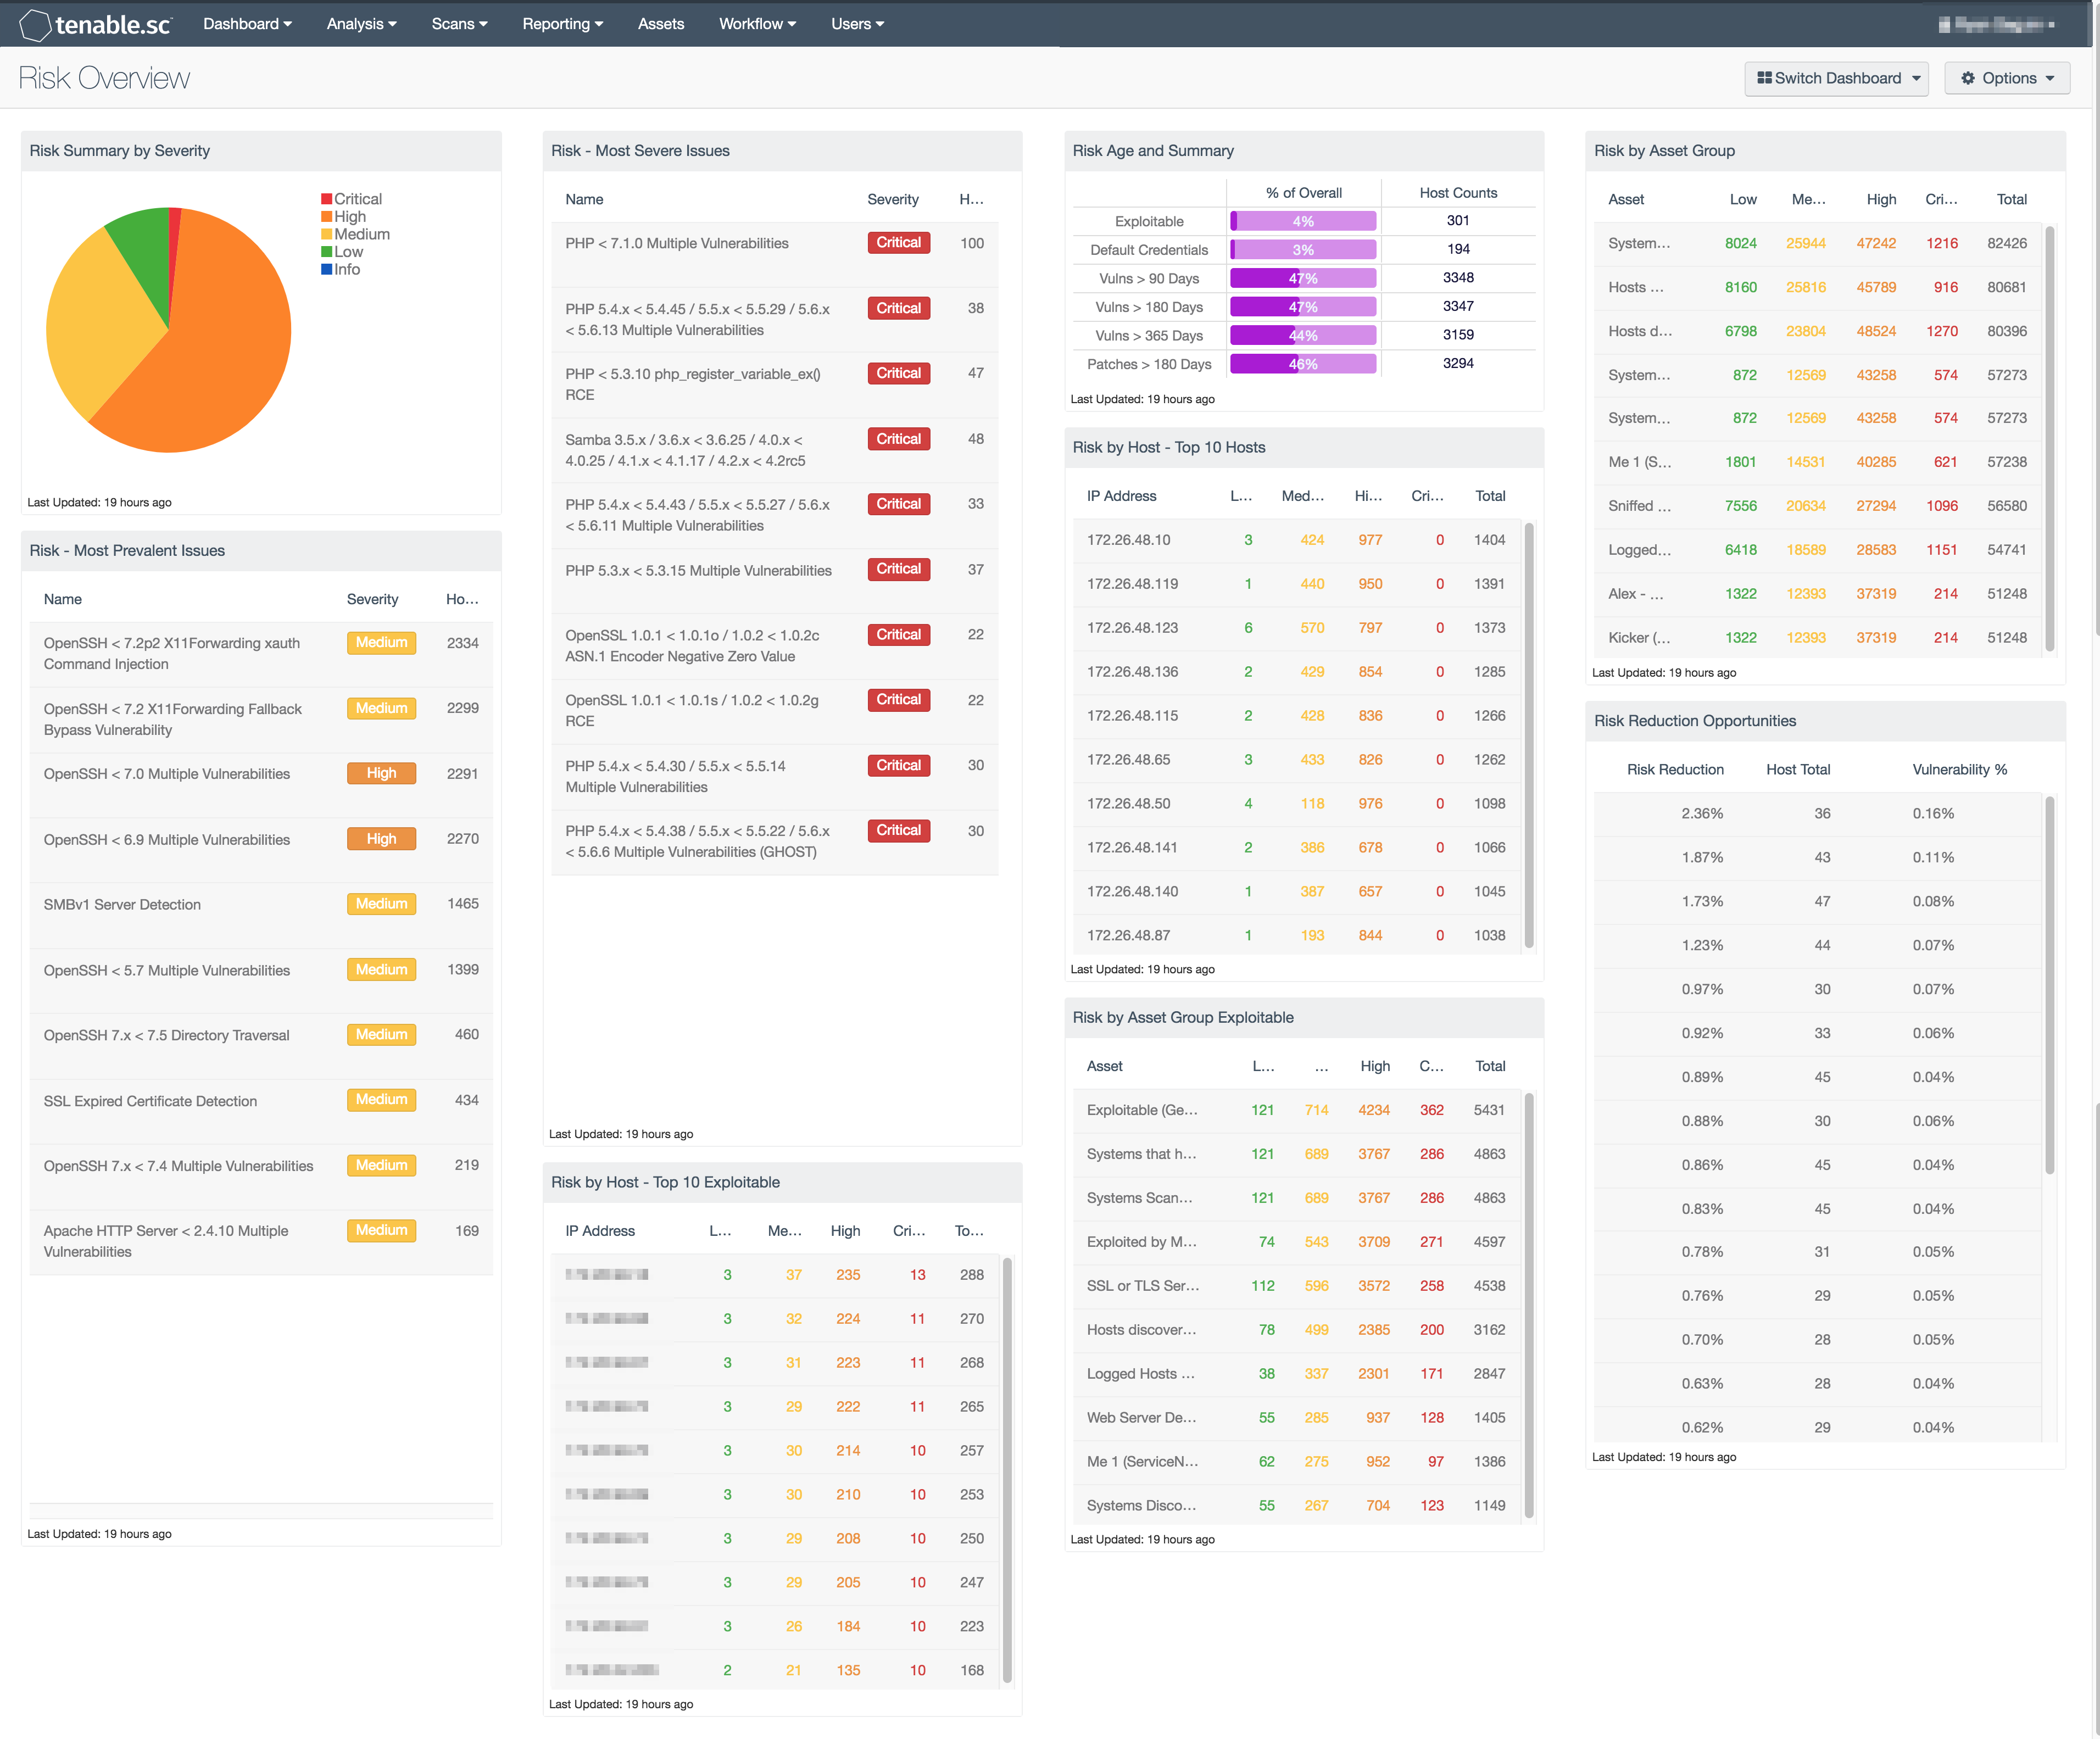
The following Risk Overview Dashboard contains the following components:
- Most Prevalent Issues - This table provides details on the most prevalent issues found to exist within the environment. Vulnerability data is sorted by the count of existing vulnerabilities within the environment.
- Most Severe Issues - This table provides details on the top 10 most severe issues found to exist within the environment. Vulnerability data is sorted by the severity of existing vulnerabilities within the environment.
- Risk by Host Top 10 - This table presents an IP Summary of all known vulnerabilities, sorted by total number of vulnerabilities per each device. Tenable.sc CV is able to present the analyst with a table that displays the most potentially vulnerable hosts and displays individual at greatest risk. The table is filtered using severity.
- Risk by Host Top 10 Exploitable - This table presents an IP Summary of all known vulnerabilities, sorted by total number of exploitable vulnerabilities per each device. Tenable.sc CV is able to present the analyst with a table that displays the most potentially vulnerable hosts and displays individual at most risk. The table filters on severity, and if known exploits are available.
- Risk by Asset Group - This table presents an Asset Summary of all known vulnerabilities, sorted by total number of vulnerabilities per asset. Tenable.sc CV is able to present the analyst with a table that displays the most potentially vulnerable hosts and displays individual at most risk. The table displays the most at risk assets, filtering on severity.
- Risk By Asset Group Exploitable - This table presents an Asset Summary of all known vulnerabilities, sorted by total number of exploitable vulnerabilities per asset. Tenable.sc CV is able to present the analyst with a table that displays the most potentially vulnerable hosts and displays individual at most risk. The table displays most at risk assets, filtering on severity, and if known exploits are available.
- Risk Summary by Severity - This pie chart provides a visual depiction of current vulnerabilities across the environment so that an analyst can rapidly identify the percentage of Critical, High, Medium, and Low vulnerabilities that are active in the database.
- Risk Age and Summary - This bar graph contains age related data as well as total host counts. The percentages of overall hosts that are vulnerable to exploits, have default credentials, or vulnerabilities that have existed over 90, 180 or 365 days is displayed. Also, any patches that are over 180 are displayed. Host counts are provided with all charts as well, allowing the analyst to quickly view what vulnerabilities exist in the environment, how long they have been active in the environment, and how successful the current patching policy is by reporting missed or missing patches over 180 days old.
- Risk Reduction Opportunities - This table provides details on actions that can be taken as risk reduction opportunities within the environment. The percentage of risk reduction, number of hosts affected, total number of vulnerabilities, and vulnerability percentage if implemented are displayed.
Tenable One
Request a demo
The world’s leading AI-powered exposure management platform.
Thank You
Thank you for your interest in Tenable One.
A representative will be in touch soon.
Form ID: 7469
Form Name: one-eval
Form Class: c-form form-panel__global-form c-form--mkto js-mkto-no-css js-form-hanging-label c-form--hide-comments
Form Wrapper ID: one-eval-form-wrapper
Confirmation Class: one-eval-confirmform-modal
Simulate Success