by Cesar Navas
When assessing Industrial Control Systems (ICS)/ Supervisory Control and Data Acquisition (SCADA) environments’ security posture, an organization must ensure their systems that are linked to critical equipment and infrastructure are secure and out of reach for potential bad actors. Unfortunately, in an Operational Technology (OT) environment, active scanning may be detrimental to normal operations and therefore passive scanning is key. This dashboard leverages information collected passively within the network, which assist security teams in measuring and reducing cyber risk.
ICS is a term which describes hardware and software that are connected to a network to support critical infrastructure. Some of the most commonly used terms used in ICS are:
- Programmable Logic Controllers (PLCs)
- Remote Terminal Units (RTU)
- Intelligent Electronic Device (IED)
- Human Machine Interface (HMI)
These connected control systems manage the operation of critical equipment within power plants, water and waste treatment plants, transport industries, and more. This convergence of OT and Information Technology (IT) has raised concerns of security as the systems can now be targeted by bad actors.
Cyber Exposure has become more prevalent due to these emerging threats. A very important step in securing an organization’s ICS environment is to know the amount of risk within the ICS network. Using Nessus Network Monitor’s (NNM) passive detections and tenable.sc, an analyst is able to quickly and efficiently comb through the data and see many attributes of a networks health. Tenable.sc provides several dashboards that provide insight into different aspects of vulnerability detection; for example, how many SCADA ports are open and the hosts with the most vulnerabilities.
The ICS Vulnerability Summary dashboard assists an organization in determining how at risk the ICS network is to known vulnerabilities. This dashboard provides the analyst with the most concerning hosts within the network, as well as the trending of risks over 90 days. Vulnerabilities associated with known TCP ports are also highlighted, allowing the organization to properly analyze risk and determine the level of exploitability.
The dashboard and components are available in the Tenable.sc Feed, a comprehensive collection of dashboards, reports, assurance report cards, and assets. The dashboard can be easily located in the Tenable.sc Feed under the category Security Industry Trends.
The dashboard requirements are:
- Tenable.sc 5.9.0
- Nessus Network Monitor 5.8.1
Tenable.sc Continuous View® (Tenable.sc CV™) along with Tenable Industrial Security enables organizations to accurately identify, investigate and prioritize vulnerabilities for critical infrastructure and operational technology. Vulnerability assessment identifies and prioritizes weaknesses that can become the pathway for adversaries to compromise control systems and disrupt critical processes. Comprehensive dashboards and reports simplify stakeholder communication. Industrial Security has comprehensive asset identification, which identifies thousands of OT and IT devices, applications and protocols, including PLCs, RTUs, HMIs, SCADA gateways, desktop computers and network devices. By passively scanning the ICS network, security teams are able to properly fingerprint the many devices that are on the network as well as identify vulnerabilities associated with said devices.
Listed below are the components included with this dashboard.
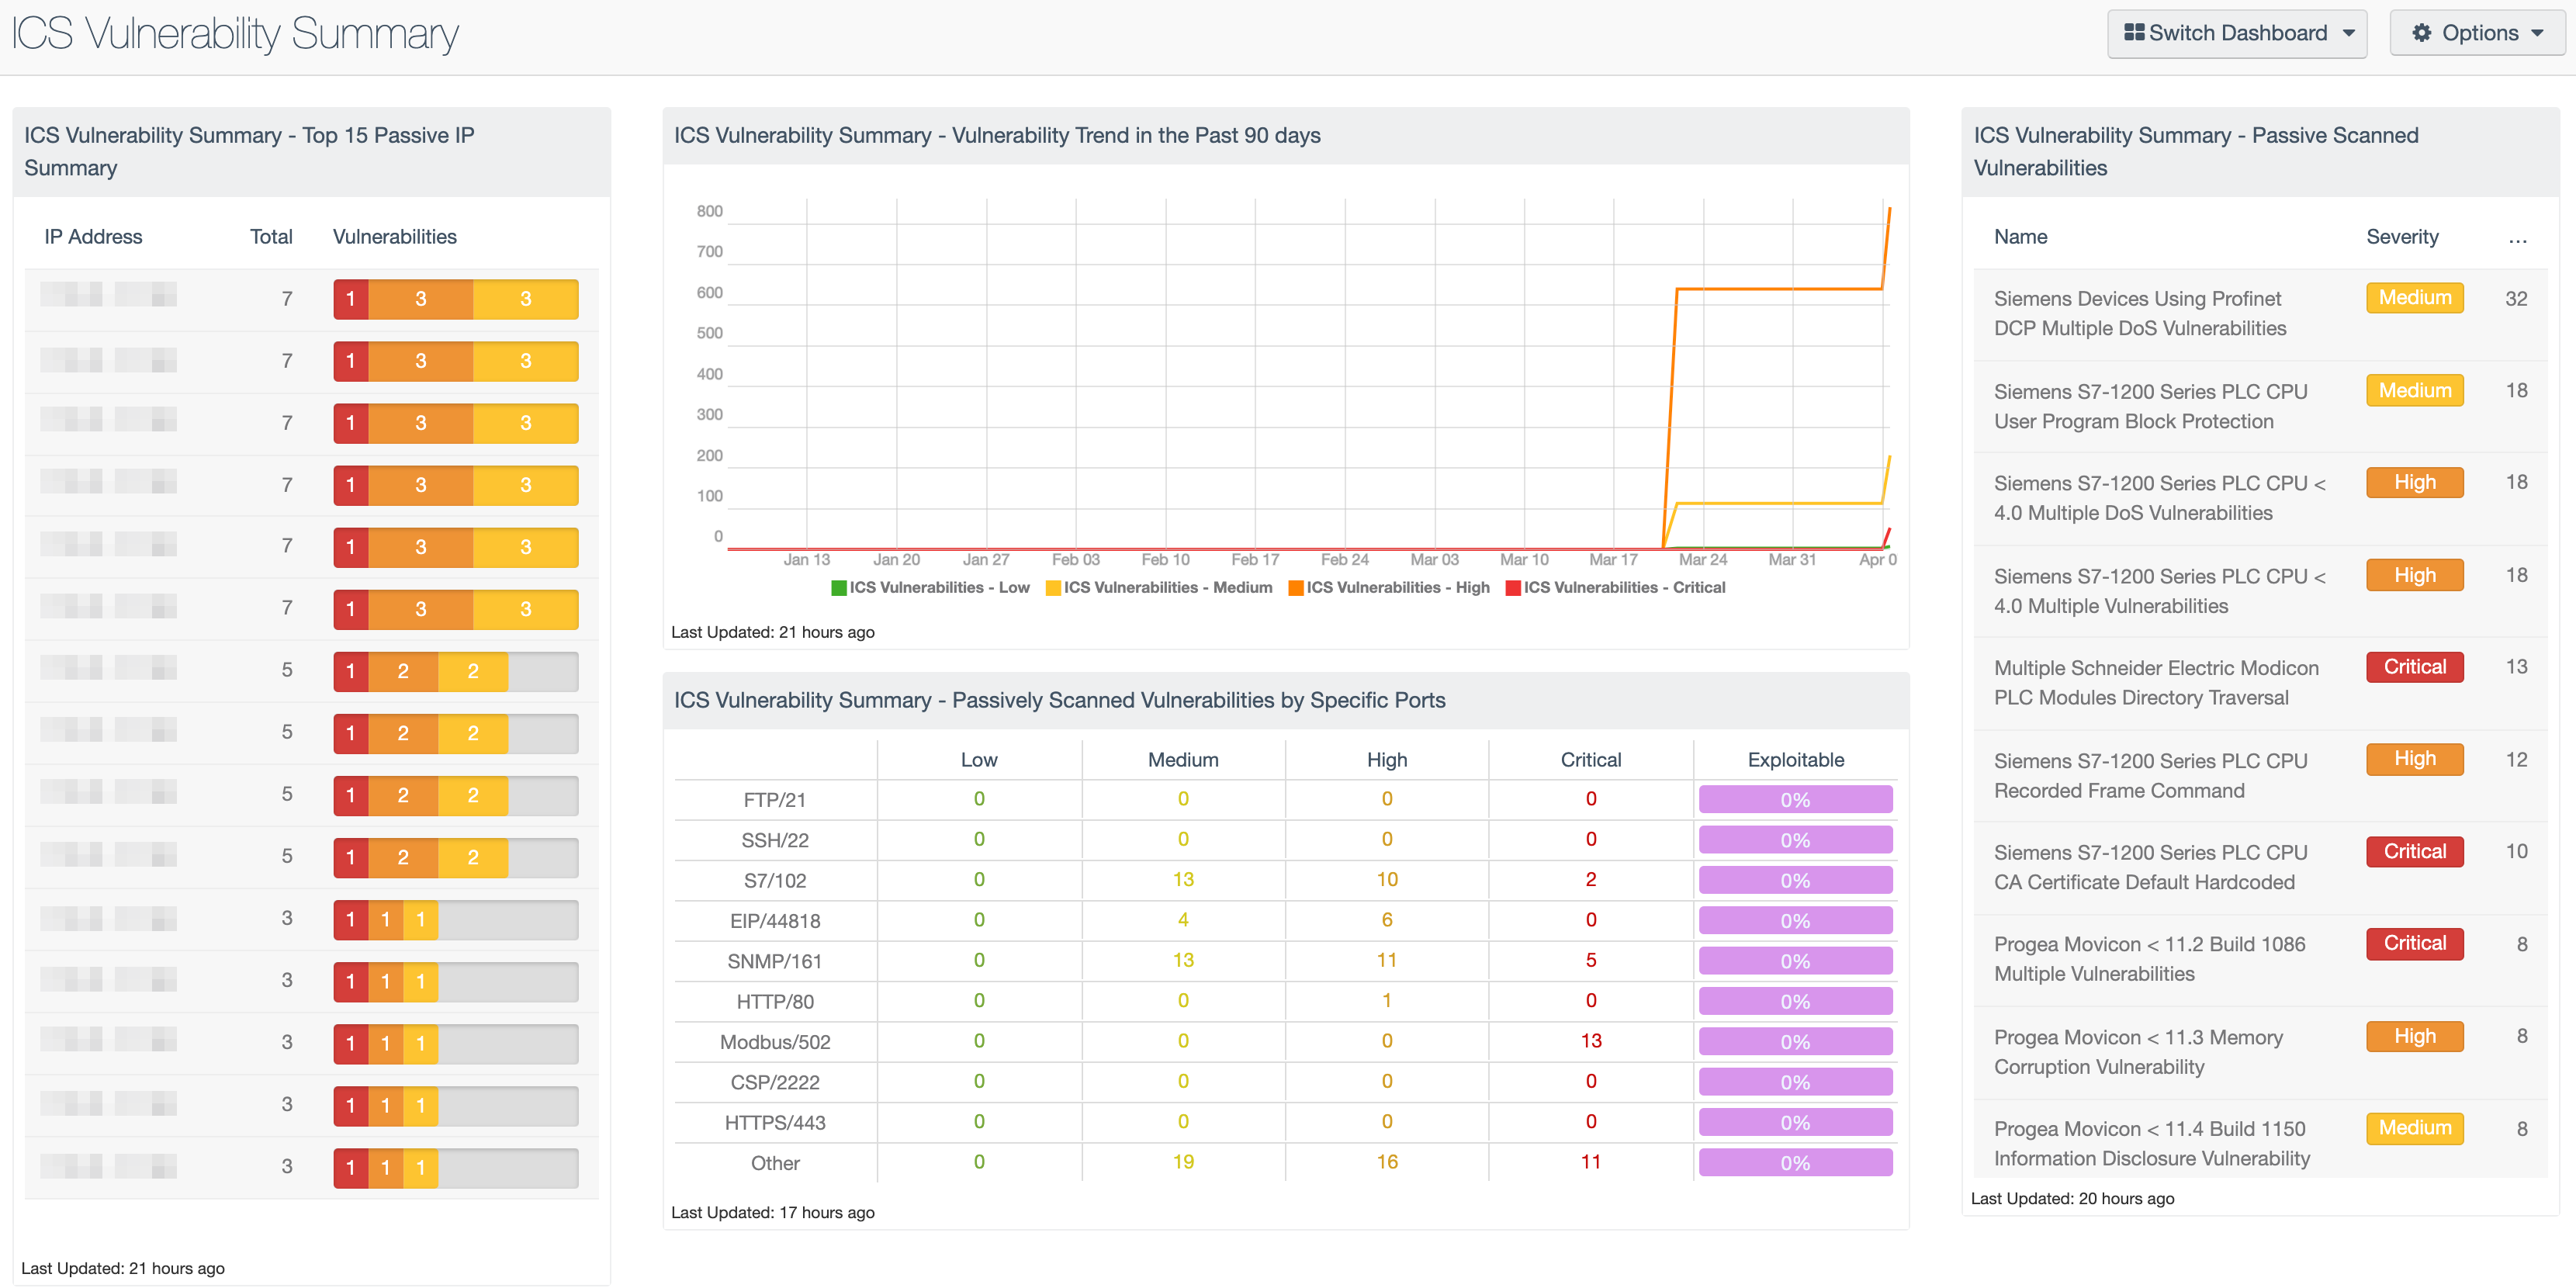
ICS Vulnerability Summary - Top 15 Passive IP Summary
The following table shows analysts the top 15 vulnerable ICS hosts that are active on the network. This table shows hosts that are passive on the network using ICS related protocols. The table is sorted in descending order, showing the hosts with the most vulnerabilities first. The plugin family filter will ensure only the SCADA family plugins are displayed. The plugin severity filter shows vulnerabilities that are related to known threats are displayed.
ICS Vulnerability Summary - Vulnerability Trend in the Past 90 days
This component assists organizations in determining and identifying progression or regression in their network's security by showing the trend of vulnerabilities over 90 days. The lines are filtered by severity to easily distinguish the vulnerabilities that are present. The component is also filtered by Vulnerability Last Observed, which shows the delta from data point to data point in the trend line. The SCADA plugin family displays vulnerabilities related to data collected from Industrial Security.
ICS Vulnerability Summary - Passively Scanned Vulnerabilities by Specific Ports
This component enumerates the number of hosts with vulnerabilities on a specific port. The columns provide a count of vulnerable hosts based on a specific port and severity level. The last column provides a percentage of hosts with an exploitable vulnerability on that port. The colors used in this matrix have a transparent background and the color changes based on the severity level. The color green represents low severities, yellow is for medium severity, high severity vulnerabilities are orange, and critical severities are red. The last column in purple shows exploitability but does not refer to severity level.
ICS Vulnerability Summary - Passive Scanned Vulnerabilities
The following table provides the analyst with most common ICS related vulnerabilities passively detected on the network. This component shows vulnerabilities filtered with the SCADA plugin family. This table is sorted in descending order, meaning the top result has the most instances with their respective vulnerability. The plugin severity filter ensures vulnerabilities that are known threats are displayed.
Tenable One
Request a demo
The world’s leading AI-powered exposure management platform.
Thank You
Thank you for your interest in Tenable One.
A representative will be in touch soon.
Form ID: 7469
Form Name: one-eval
Form Class: c-form form-panel__global-form c-form--mkto js-mkto-no-css js-form-hanging-label c-form--hide-comments
Form Wrapper ID: one-eval-form-wrapper
Confirmation Class: one-eval-confirmform-modal
Simulate Success