by Josef Weiss
October 23, 2014

Tracking insiders through log analysis and account auditing is a key component of the SecurityCenter Continuous View. This collection provides details about VPN event triggers, and provides information on the local network and where user accounts are used. The four components provide details about VPN specific events, with one component providing details on New User and New Network User events.
A VPN allows access secure access to your internal network from external sources. Strong passwords, authentication measures, and secure protocols are not enough to protect against every threat. The need to understand where users are connecting from is a critical requirement to maintaining a secure network.
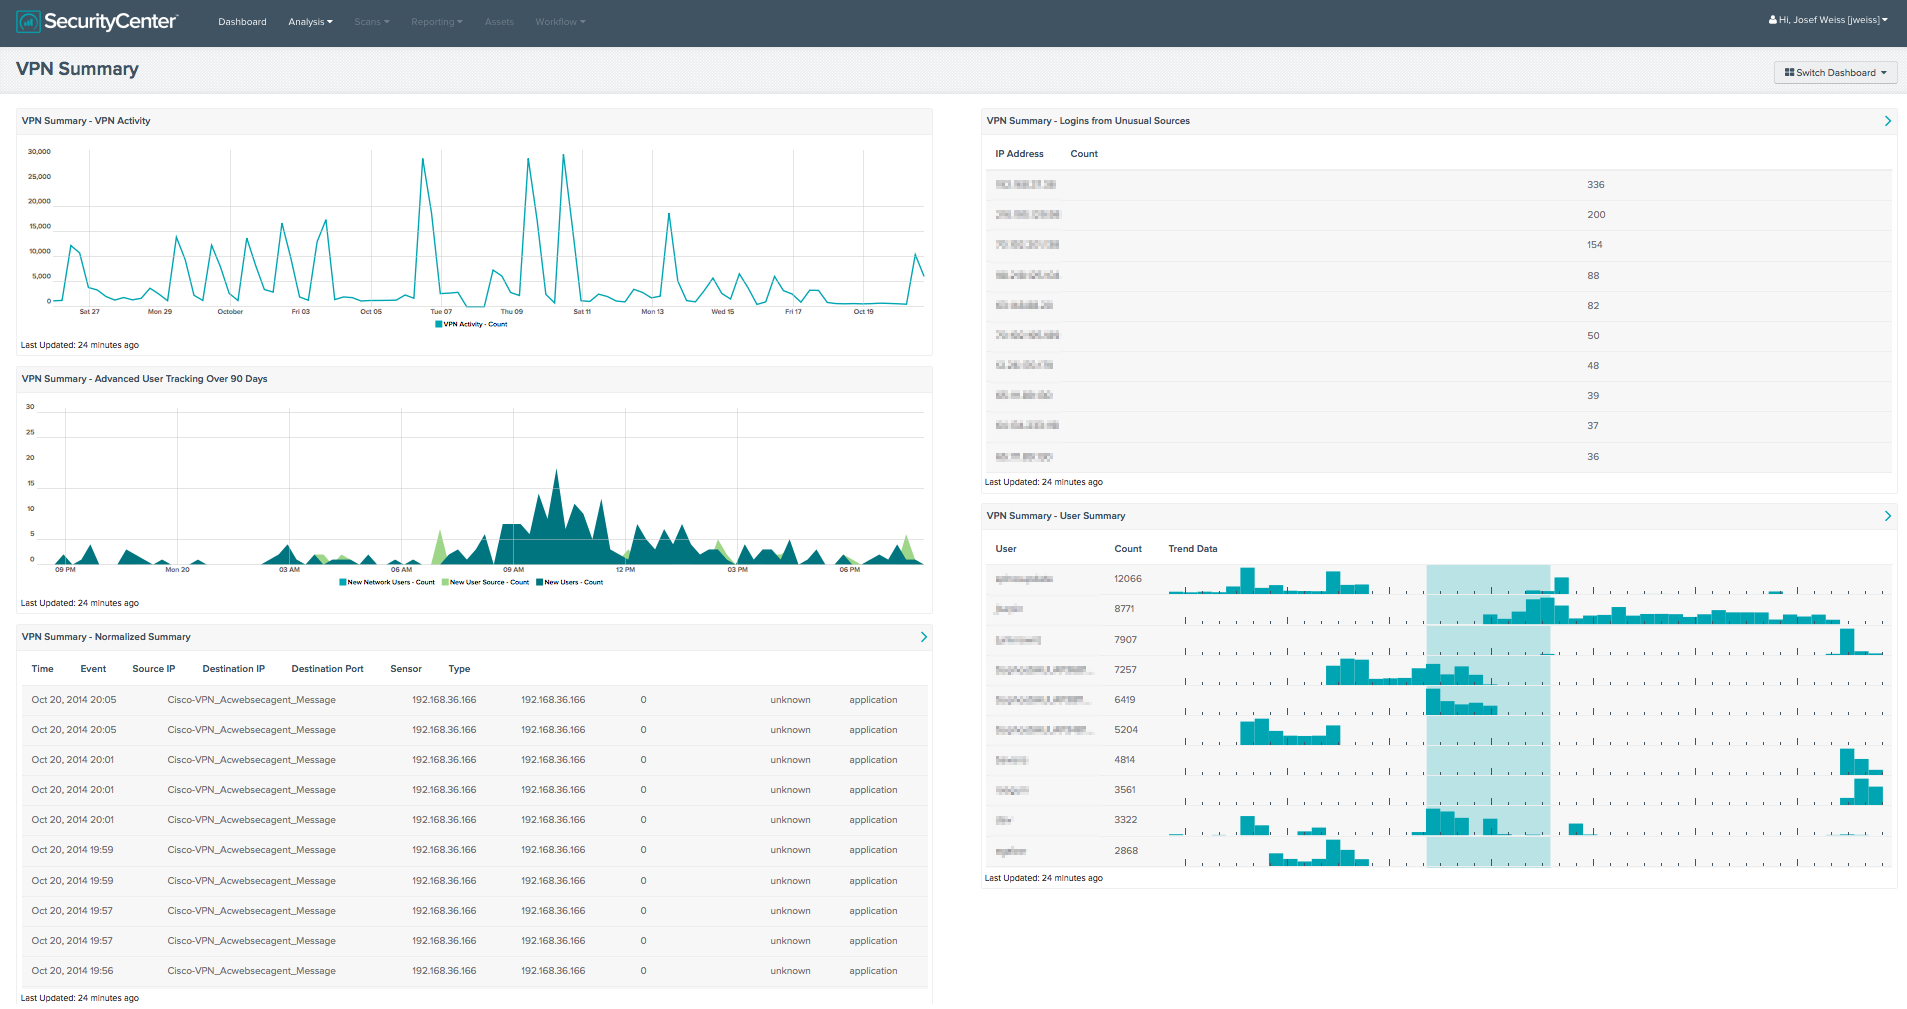
This collection gives the analyst a visual representation of VPN use over time, user summaries, advanced user tracking, and logins from unusual sources. Logins from unusual sources is a key feature of this collection. The VPN_Login_From_Unusual_Sources TASL, monitors several VPN login events and tracks users based on the source IP of the login. Triggered events could be the result of VPN users that are moving from location to location, or compromised accounts.
The dashboard and its components are available in the SecurityCenter Feed, a comprehensive collection of dashboards, reports, assurance report cards and assets. The dashboard can be easily located in the SecurityCenter Feed under the category Security Industry Trends.
The dashboard requirements are:
- SecurityCenter 4.8.1
- LCE 4.4.0
SecurityCenter Continuous View allows for the most comprehensive and integrated view of network health and provides the most complete solution to identify emerging threats. By using the Log Correlation Engine (LCE), the organization can perform deep log analysis detecting possible systems with elevated risk.
The following components are included in this collection:
- VPN Activity - This component presents the analyst with a trend of all VPN event activity over the last 25 days. This is accomplished through utilizing a line chart and setting the data type to event. Further filtering utilizes the *VPN* keyword Normalized Event filter, and setting the Time (x-axis) to 25 days. This allows the analyst to have a visual representation of all VPN events that have occurred within the specified timeframe. Unusual spikes in VPN event activity could represent abnormal activity, and should be investigated further.
- Normalized Summary - This table component presents the analyst with a list of triggered events sorted by time, for the last 7 days. Events that occurred most recently will be listed at the top of the table; the last 50 will be shown. This table is useful to the analyst to see what VPN are currently being triggered in the environment. The update frequency of this table is set to one hour; therefor this table will update results every hour. This update frequency can be altered to a frequency from as small as 15 minutes to a specific day within a month. The table utilized a List of Event tool, with the Normalized Event filter of *VPN* and timeframe set to 7 days.
- Logins from Unusual Places - This table presents event data from the Tenable Log Correlation engine’s VPN_Login_From_Unusual_Source event where the LCE has seen a VPN authentication occur from a source that is not normal for the user ID. Once the LCE determines a users “Normal Source”, it will alert on any unusual sources of logins for that user. By default, the triggered event occurs if the normal source and the new source are not part of the same class B. This table presents the IP address and number of events for the reported IP address over 90 days.
- User Summary - This table component presents the analyst with a User Summary of “*VPN*” events over the last 7 days. The top 50 results are displayed, sorted by count, and presents both the user and trend data.
- Advanced User Tracking Over 90 Days - This line chart component utilizes events generated by the Log Correlation Engine as it learns about each new user and the relations they have with each system. This line graph represents triggered events from collected from three events. The New_User, New_User_Source, and New-Network-User events are present with the LCE has learned about a new user account on a specific system, the LCE has learned about a source system where an account has originated from the first time, and when LCE has observed an authentication log in which the relationship between a user ID and the IP address associated with it has changed, respectively. Data is presented over the last 90 days.