by Josef Weiss
February 26, 2016
Monitoring the status of multiple security devices can be a challenge for security teams. The pressure to track down and remediate vulnerabilities often overshadows the routine tasks to ensure the health of the security devices. With the help of SecurityCenter, security teams can monitor the health of all their Tenable applications from one place.
The Tenable Admin dashboard is a collection of components that provide administrators a platform for monitoring the health and status of their Nessus scanners, Passive Vulnerability Scanners (PVS) and Log Correlation Engines (LCE) through their connection to SecurityCenter. The devices that perform audits, scans, and log analysis should be monitored for the same level of health and security as the network they are monitoring. Analysts who are responsible for the system administration of their Tenable applications will find this dashboard essential in their maintenance processes.
The components in this dashboard bring focus to each Tenable application and alert analysts to any errors, warnings, or other notable events that have occurred. The health of Tenable applications is determined through logs collected using the LCE. By searching for specific types of normalized events and displaying them in a meaningful format, important information about the status of an organization’s Tenable applications becomes readily available. The components display useful information including license expiration information, service status, SecurityCenter database warning messages, and more.
In order to maximize the amount of data consumable by SecurityCenter, the LCE Client is required be installed on each Tenable application, and the matching LCE Client policy should be assigned to the host. The following Nessus audit files should also be used to check configurations parameters along with any additional audit files specific to the environment:
- LCE_check
- PVS_check
- SecurityCenter_check
- Nessus_Check
This dashboard aligns with the NIST Cybersecurity Framework (CSF) subcategories DE.CM-8 and PR.PT-1 that deal with vulnerability scanning and log analysis.
The dashboard and its components are available in the SecurityCenter Feed, a comprehensive collection of dashboards, reports, assurance report cards and assets. The dashboard can be easily located in the SecurityCenter Feed under the category Monitoring.
The dashboard requirements are:
- SecurityCenter 4.8.2
- Nessus 6.4.2
- PVS 4.4.0
- LCE 4.6.0
- Deployed LCE Clients
SecurityCenter Continuous View (CV) provides continuous network monitoring, vulnerability identification, risk reduction, and compliance monitoring. Nessus is continuously updated with information about advanced threats and zero-day vulnerabilities, and new types of regulatory compliance configuration audits. PVS provides deep packet inspection to continuously discover vulnerabilities and Indicators of Compromise (IOC) traveling the wire. LCE correlates real-time events, such as DNS queries, and then performs analysis to discover vulnerabilities and IOC. LCE also has the capability to discover users, operating systems, network devices, hypervisors, databases, tablets, phones, web servers, and other critical infrastructure. SecurityCenter CV allows for the most comprehensive and integrated view of network health.
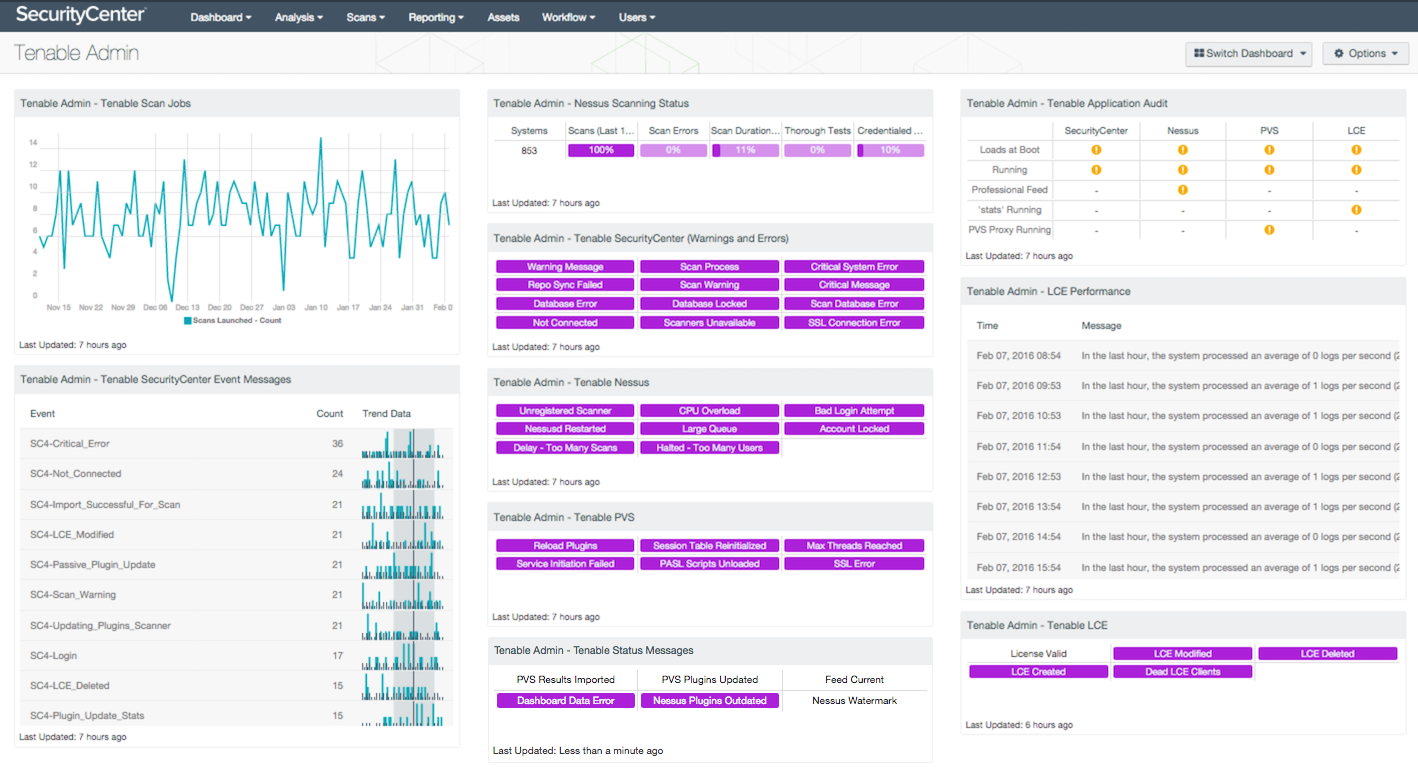
This dashboard contains the following components:
- Tenable Admin - Tenable Scan Jobs: A trend line that displays a graphical representation of the number of scans started over the last 90 days. This provides a visual representation of scanning activity to the administrator, displaying dates that scans were active and their counts.
- Tenable Admin – Tenable Security Center Event Messages: This table displays all SecurityCenter event messages. Displayed are the event name, count, and trend data for the previous 24 hours. Filters are based on the Normalized Event Summary tool for any event that contains “SC4-”. These events show usage, change, errors, and other items that should be tracked.
- Tenable Admin – Nessus Scanning Status: This matrix component displays normal indicators when certain criteria are met, such as daily PVS/Nessus plugin updates, feed data is valid and not expired, results are imported daily, and all dashboard components are functioning properly. It displays purple indicators if any failures occur.
- Tenable Admin - Tenable Security Center (Warnings and Errors): This matrix component provides the administrator with an indicator that alerts when certain SecurityCenter events are triggered. Alerts include important SecurityCenter warnings and errors that can affect performance. The event timeframe is the last 72 hours.
- Tenable Admin – Tenable Nessus: This matrix component displays event data in regard to Nessus scanners. Unregistered and overloaded scanners are among several indications present. This helps administrators identify rogue Nessus scanners and potential problems.
- Tenable Admin – Tenable PVS: This matrix component displays event data in regard to Passive Vulnerability Scanners. Scanner SSL Connection Errors, Maximum Number of Threads being reached, and Service Initiation Failures are among several indicators present.
- Tenable Admin – Tenable Status Messages: This matrix component displays normal indicators when certain criteria are met, such as daily PVS/Nessus plugin updates, feed data is valid and not expired, results are imported daily, and all dashboard components are functioning properly. It displays purple indicators if any failures occur.
- Tenable Admin – Tenable Application Audit: This component capitalizes on the audit findings to present the administrator with information on Tenable applications. Information on the running state of the applications, and if they are configured to start on boot, are presented.
- Tenable Admin – Tenable LCE: This matrix component displays event data related to Tenable's Log Correlation Engine. It includes indicators that trigger if the LCE license is within 5 days of expiration, and if any modifications have occurred to the LCE. “Dead” (unreachable) LCE Clients are also tracked.
- Tenable Admin - LCE Performance: LCE allows tracking of performance events related to events per second. This table displays messages every hour on LCE statistical events. These log messages contain data on events per second (EPS), number of logs processed, log source breakdown, information on types of logs processed, and more.