by Josef Weiss
March 5, 2015
During a resource attack, a resource is depleted to the point that its functionality is affected. Virtually any resource can be targeted using this type of attack. The result of a successful resource attack is usually the degrading or denial of one or more services. To prevent resource depletion, you should monitor normal network activity and devices. General resources that present easy targets are CPU cycles, RAM, network throughput and I/O operations.
By utilizing LCE and deployed LCE Clients, these resources can be easily monitored through SecurityCenter Continuous View (CV). Each LCE Client sends a heartbeat message containing a snapshot of the system's existing CPU, memory and disk usage. The System Monitor TASL script includes some default levels for global alerting, and these can be overridden by editing a file named system_monitor.conf in the local LCE plugins directory. By default, this script will generate a new alert any time a CPU rating of more than 90%, a memory usage of more than 90%, a disk usage of more than 90% has been encountered or a load level larger than 3. To modify these settings, consult the Log Correlation Engine documentation.
This collection contains five components to assist the analyst in monitoring resource depletion. The components trend event spikes and high utilization events found within the environment for the most common targets, CPU cycles, RAM utilization, network throughput and I/O operations. The results are displayed to the analyst via trend and matrix indicator components. Positioning the mouse cursor along the trend presents a pop-up indication containing the date/time and count.
The dashboard and its components are available in the SecurityCenter Feed, a comprehensive collection of dashboards, reports, assurance report cards and assets. The dashboard can be easily located in the SecurityCenter Feed under the category Monitoring.
The dashboard requirements are:
- SecurityCenter 4.8.2
- LCE 4.4.1
- PVS 4.0.3
Tenable's SecurityCenter CV is the market-defining continuous network monitoring platform. SecurityCenter CV includes active vulnerability detection with Nessus, passive vulnerability detection with Passive Vulnerability Scanner (PVS), and log correlation with Log Correlation Engine (LCE). Using SecurityCenter CV, an organization will obtain the most comprehensive and integrated view of its network. LCE provides deep packet inspection to continuously discover and track users, applications, cloud infrastructure, trust relationships, and vulnerabilities.
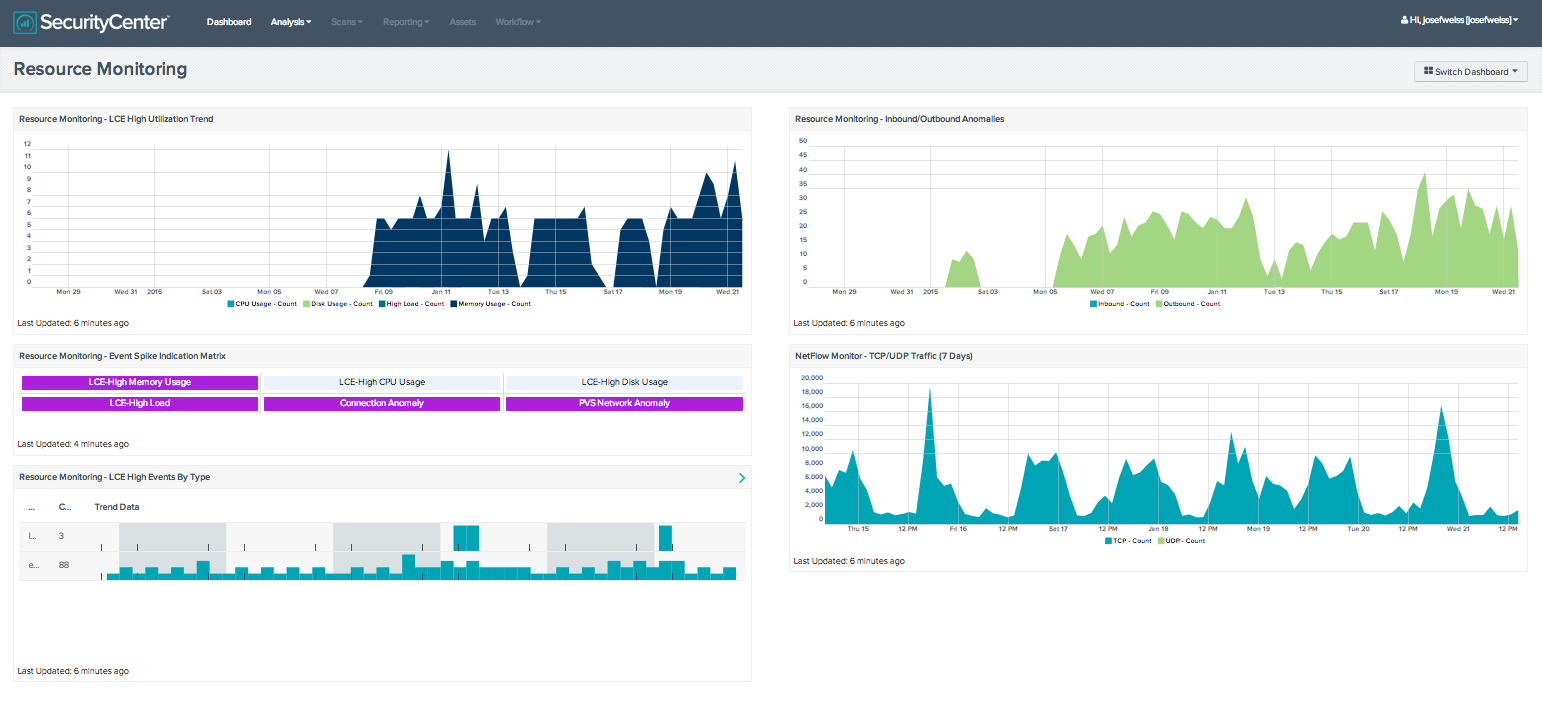
The collection contains the following components:
- Resource Monitoring – LCE High Utilization Trend - This chart trends high utilization events found within the environment for the most common targets: CPU cycles, RAM utilization, network throughput and I/O operations. Results are displayed to the analyst in an easy to understand graph covering the previous 25 days. Positioning the mouse cursor along the trend presents a pop-up indication that contains the date/time and event count.
- Resource Monitoring – Event Spike Indication Matrix - This matrix component provides indication for event spikes found within the environment for the most common targets: CPU cycles, RAM utilization, network throughput and I/O operations. Triggered events are displayed to the analyst in an easy to understand indicator matrix covering the previous 72 hours. An indicator that is highlighted purple represents that a spike event is present for during the designated time period.
- Resource Monitoring – LCE High Events by Type - This table component displays high utilization events found within the environment by type. Results are displayed to the analyst in an easy to understand table covering the previous 72 hours. This allows the analyst to correlate high utilization events to specific event types, such as errors. High utilization events that are all of a specific type could indicate potential areas of concern within the environment.
- Resource Monitoring – Inbound/Outbound Anomalies - This chart trends inbound and outbound connection anomalies found within the environment. Results are displayed to the analyst in an easy to understand graph covering the previous 25 days. Positioning the mouse cursor along the trend presents a pop-up indication, which contains the date/time and count.
- NetFlow Monitor - TCP/UDP Traffic (7 Days) - This component presents the analyst with a graphical representation and trending for TCP vs. UDP over the specified timeframe. This provides a fast method to conduct visual trend analysis of specific protocols.