by David Schwalenberg
May 24, 2016
Reviewing system and network logs is a recommended security best practice, but it can be a daunting task. Administrators rarely have time to do in-depth log analysis. Similar information is presented in widely varying ways within different logs. There is so much log information that without some way to correlate and reduce the logs, important indicators can be hidden and overlooked.
Fortunately, the Tenable Log Correlation Engine (LCE) can help. The LCE collects, normalizes, and correlates logs, triggering secondary alerts on potentially interesting or suspicious activity. Detecting events that occur without stopping for long periods of time is a core form of correlation performed by the LCE. The LCE can identify hosts that are generating specific event types for periods of 20 minutes or longer. For example, when a system generates error messages over and over in vain trying to tell a user that something is wrong, these messages can go unnoticed if they are buried in a sea of other status and logging messages. The LCE's correlation of continuous events can help reveal this issue. Any continuous activity should be investigated because the activity may indicate system or network problems, or even network attacks.
This dashboard allows an analyst to quickly review any continuous events that have been generated, and drill down for more details if needed. This dashboard, along with similar dashboards such as the Stats Summary and Never Before Seen Summary dashboards, can assist in the job of log analysis and help to more easily and quickly discover system and network concerns. For more information on the event correlation techniques used by LCE to detect abuse, anomalies, and compromise, see the Tenable Event Correlation whitepaper.
This dashboard and its components are available in the SecurityCenter Feed, a comprehensive collection of dashboards, reports, Assurance Report Cards, and assets. The dashboard can be easily located in the SecurityCenter Feed under the category Monitoring. The dashboard requirements are:
- SecurityCenter 5.3.2
- LCE 4.8.0
Tenable SecurityCenter Continuous View (CV) is the market-defining continuous network monitoring solution. SecurityCenter CV includes active vulnerability and configuration scanning, passive monitoring and detection, and log normalization and correlation. SecurityCenter CV is continuously updated with information about advanced threats, zero-day vulnerabilities, and new regulatory compliance data. Using SecurityCenter CV, an organization will obtain the most comprehensive and integrated view of its network.
The following components are included in this dashboard:
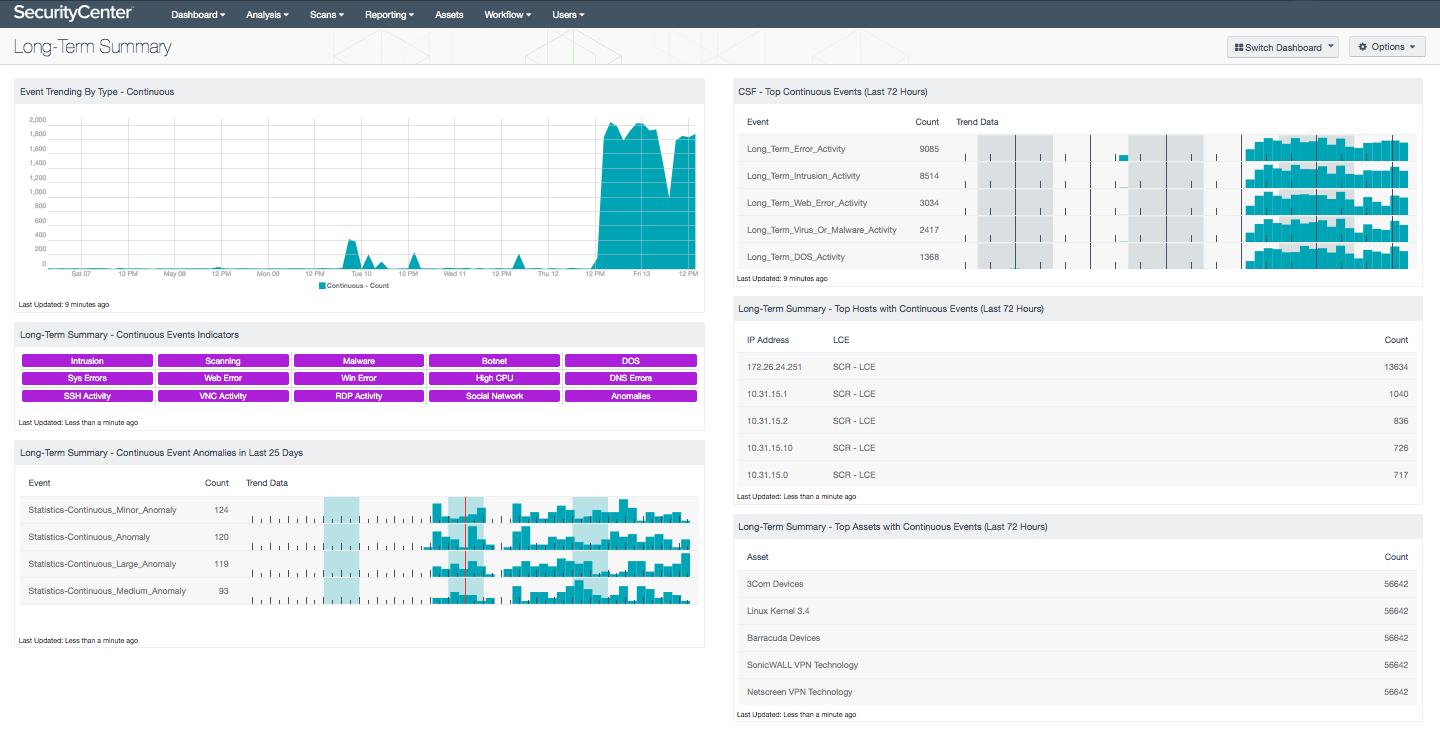
- Event Trending By Type - Continuous: This component displays a 7-day trend analysis of events with continuous activity. The LCE can identify hosts that are generating specific event types for periods of 20 minutes or longer. For example, a host may be infected with a worm and attack small numbers of targets every five minutes.
- Long-Term Summary - Continuous Events Indicators: This component presents indicators for each of the potential continuous (long-term) events recorded by LCE in the last 72 hours. These events include long-term intrusion and malware activity, long-term errors, long-term high CPU activity, long-term network activity, and long-term statistical anomalies. The indicator will be highlighted purple if the corresponding events occurred. Clicking on a highlighted indicator will bring up the event analysis screen to display the anomaly events and allow further investigation.
- Long-Term Summary - Continuous Event Anomalies in Last 25 Days: This table displays the counts and trend graphs for continuous (long-term) event statistical anomalies in the last 25 days. The events in this table indicate that there has been a change in the number of long-term events during a given hour compared to that same hour on previous days. The size of the anomaly (minor to large) is determined by the amount of change, in terms of standard deviations. This table highlights if spikes in continuous activity have occurred and when they occurred. Clicking on the Browse Component Data icon will bring up the event analysis screen to display the anomaly events and allow further investigation. In the analysis screen, setting the tool to Raw Syslog will display the raw syslog of the anomaly events, which can give more details and will include the names of the long-term events that caused the anomalies.
- CSF - Top Continuous Events (Last 72 Hours): This table displays the top continuous, or long-term, events detected on the network in the last 72 hours. The table is sorted so that the continuous events detected most often are at the top. Detecting events that occur without stopping for long periods of time is a core form of correlation performed by the LCE. The LCE can identify hosts that are generating specific event types for periods of 20 minutes or longer. This table can be used by an analyst to investigate recent continuous network activity and determine if it may indicate network problems. Clicking on the Browse Component Data icon will bring up the event analysis screen to display all of the continuous events and allow further investigation.
- Long-Term Summary - Top Hosts with Continuous Events (Last 72 Hours): This table displays the top hosts with the most continuous (long-term) events detected in the last 72 hours. The table is sorted so that the host with the most continuous events is at the top. Detecting events that occur without stopping for long periods of time is a core form of correlation performed by the LCE. The LCE can identify hosts that are generating specific event types for periods of 20 minutes or longer. This component can be used by an analyst to investigate hosts with recent continuous activity and determine if the activity may indicate problems. Clicking on the Browse Component Data icon will bring up the event analysis screen to display all of the hosts with continuous events and allow further investigation.
- Long Term Summary - Top Assets with Continuous Events (Last 72 Hours): This table displays the top asset groups with the most continuous (long-term) events detected in the last 72 hours. The table is sorted so that the asset group with the most continuous events is at the top. Detecting events that occur without stopping for long periods of time is a core form of correlation performed by the LCE. The LCE can identify hosts that are generating specific event types for periods of 20 minutes or longer. This component can be used by an analyst to investigate groups of systems with recent continuous activity and determine if the activity may indicate problems. Clicking on the Browse Component Data icon will bring up the event analysis screen to display all of the asset groups with continuous events and allow further investigation.