by David Schwalenberg
April 16, 2015

Many services used by today's organizations are cloud based. An organization can use Tenable's Tenable.sc Continuous View to detect and track what cloud services are being used, discover if any unauthorized cloud service interactions are occurring, and even determine potential vulnerabilities associated with the use of cloud services.
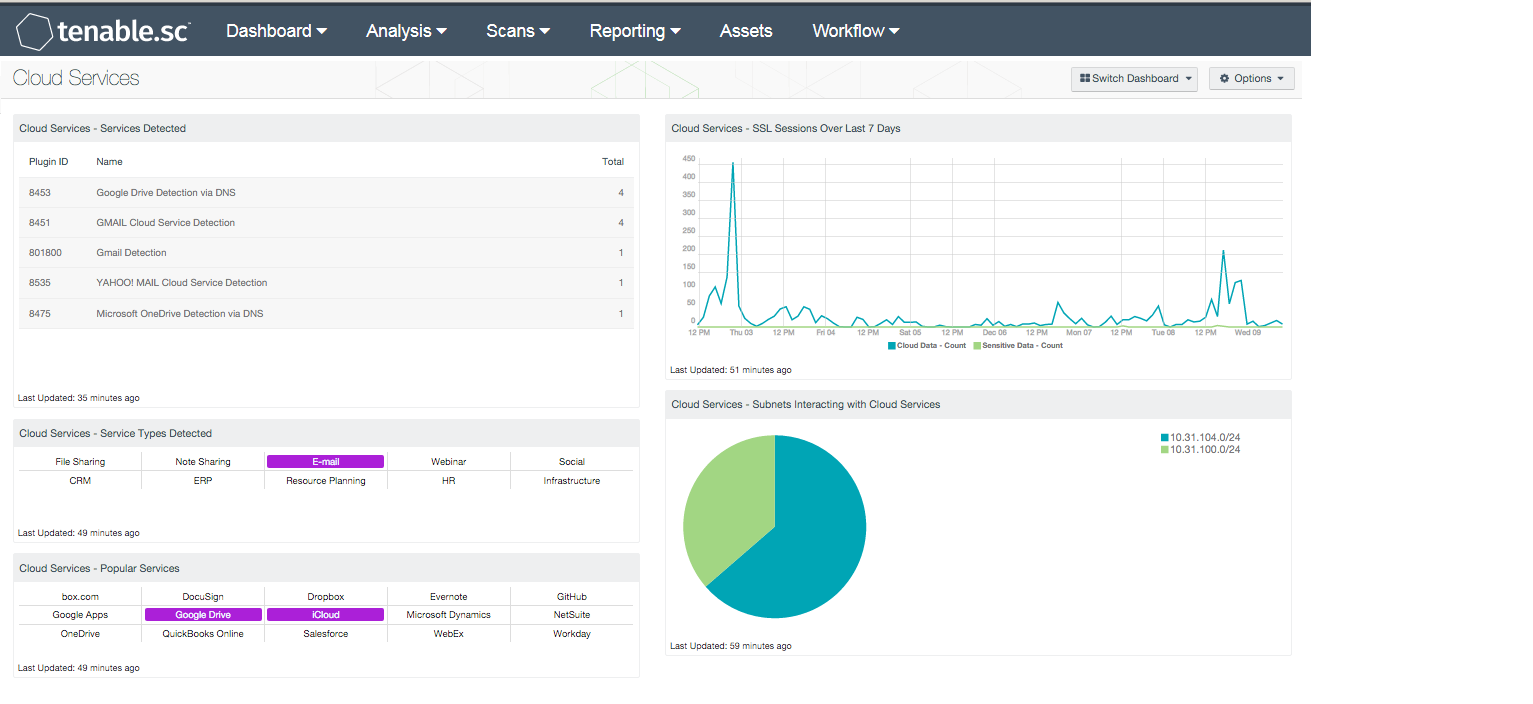
This dashboard presents detections of network interactions with cloud services such as file storage and sharing services, customer relationship management (CRM) services, resource planning services, and others. Additional components on the dashboard present cloud service interactions by service type, track cloud service sessions, and display which subnets on the network interact most with cloud services.
The dashboard and its components are available in the Tenable.sc Feed, a comprehensive collection of dashboards, reports, assurance report cards and assets. The dashboard can be easily located in the Tenable.sc Feed under the category Monitoring.
The dashboard requirements are:
- Tenable.sc 4.8.2
- Nessus 8.5.2
- NNM 5.9.0
- LCE 6.0.0
Tenable's Tenable.sc Continuous View (Tenable.sc CV) is the market-defining continuous network monitoring platform. Tenable.sc CV includes active vulnerability detection with Nessus and passive vulnerability detection with Tenable's Nessus Network Monitor (NNM), as well as log correlation with Tenable's Log Correlation Engine (LCE). Using Tenable.sc CV, an organization will obtain the most comprehensive and integrated view of its network and the cloud services it is using.
Listed below are the included components:
- Cloud Services - Services Detected - This table presents a list of passive detections of network interactions with cloud services. The list is sorted so that the cloud service most often detected is at the top. This information can be used to determine which cloud services are most used and if any unauthorized services are being used.
- Cloud Services - Service Types Detected - This matrix presents indicators that highlight the different types of cloud services detected. A service type field is included in many of the LCE plugins that detect network interactions with cloud services; a purple indicator means that services of that particular type were detected. Clicking on an indicator will bring up the analysis screen to display details on the detections. In the analysis screen, setting the tool to IP Summary will display the systems that interacted with the cloud services. The cloud service types are:
- File Sharing (such as Dropbox and iCloud)
- Note Sharing (such as Evernote and Todoist)
- Email (such as Gmail and Outlook.com)
- Webinar (such as WebEx and GoToMeeting)
- Social (such as Jive)
- Customer Relationship Management (CRM) (such as Salesforce and Base CRM)
- Enterprise Resource Planning (ERP) (such as NetSuite and QuickBooks Online)
- Resource Planning (such as Workday and Basecamp)
- Human Resources (such as ADP and DocuSign)
- Infrastructure (such as Microsoft Azure)
- Cloud Services - Popular Services - This matrix presents indicators for 15 popular cloud services. A purple indicator means that the service was actively or passively detected; clicking on the indicator will bring up the analysis screen to display details on the detection and any associated vulnerabilities. In the analysis screen, setting the tool to IP Summary will display the systems that interacted with that cloud service. Indicators can be removed or new indicators added as desired.
- Cloud Services - SSL Sessions Over Last 7 Days - This chart presents a 7-day trend graph of SSL sessions initiated to cloud services in two categories. The "Cloud Data" category includes cloud storage services such as Dropbox, Google Drive, and SpiderOak. The "Sensitive Data" category includes cloud services used to maintain sensitive organizational data, such as ADP, Salesforce, and NetSuite.
- Cloud Services - Subnets Interacting with Cloud Services - This chart presents the top Class C subnets that have passively detected interactions with cloud services. This information can be used to determine which subnets are interacting with cloud services the most and if any unauthorized interactions are occurring.